In this post we will cover some of the new features added to Stock Rover V10. The improvements encompass the Dashboard, the Insight Panel and the Chart.
There are also new features in Portfolio Analytics, new screening capabilities, and a host of new metrics.
Contents
Dashboard Improvements
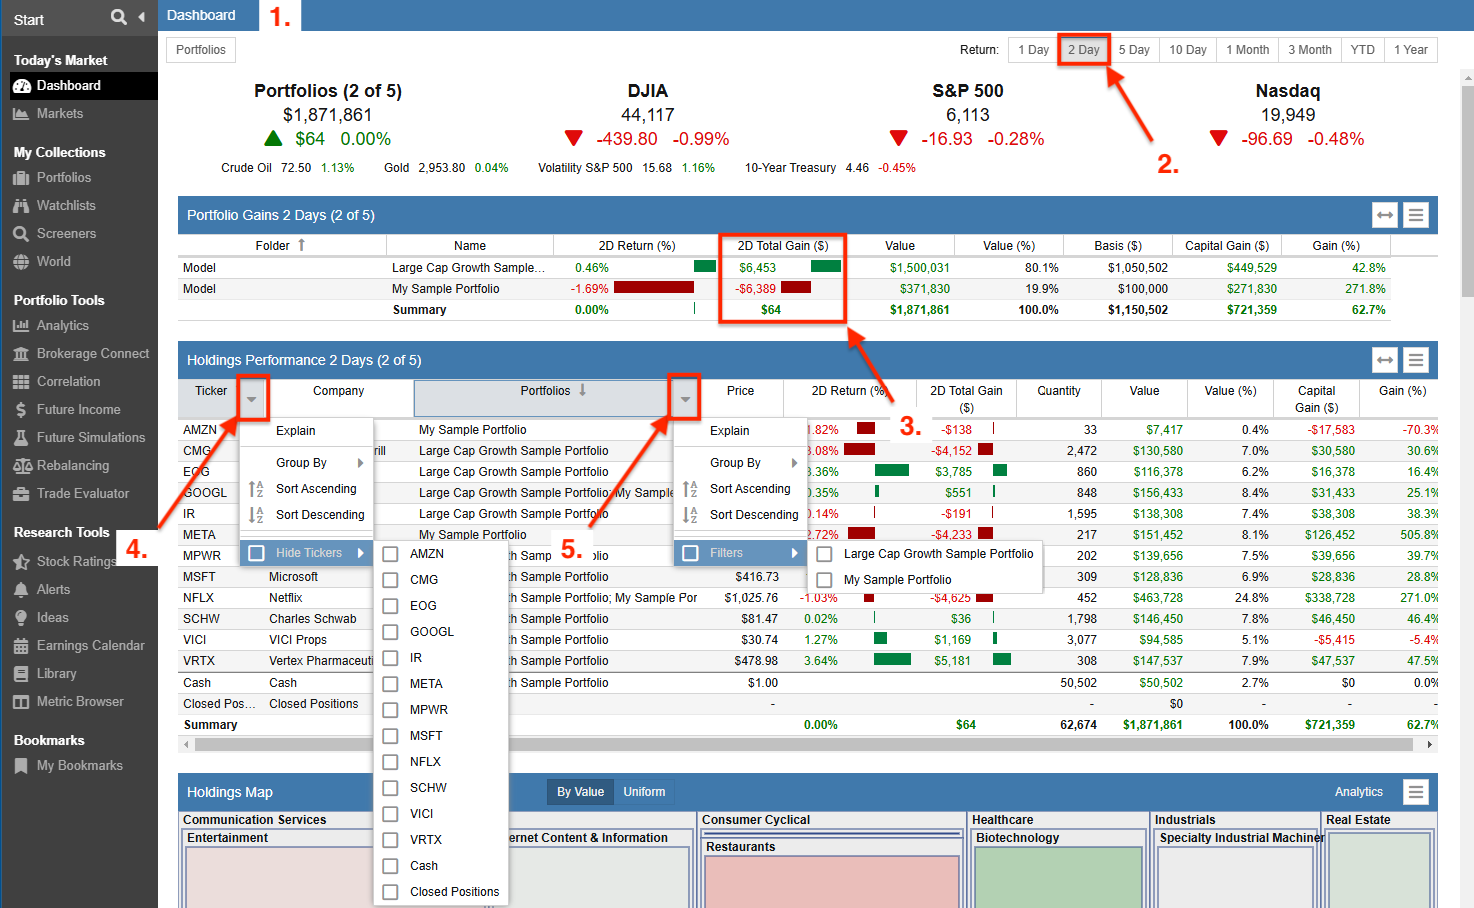
The Dashboard [8] now uses more of the screen’s width. The wider layout improves readability and makes better use of available screen real estate (1).
A new “2-Day” performance analysis option is available. A 2-day performance analysis can highlight how the market is reacting to an earnings report or other important news (2).
The Gain $ is now displayed with a bar, making it easier to compare gains across holdings (3).
Holdings Performance can now be filtered by Ticker and whether to include Cash, allowing for more focused analysis (4).
Holdings Performance can also be filtered by Portfolio, allowing for a more granular examination of specific portfolios (5).
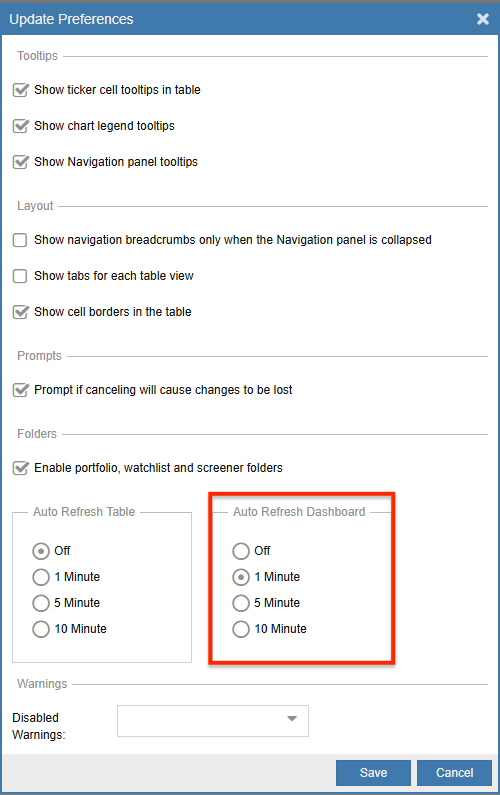
The Dashboard can now be configured to automatically refresh, ensuring you always see the most up-to-date portfolio and market performance data.
You can set the refresh interval under Preferences [10] and the Dashboard will dynamically update. This improvement allows you to monitor market changes and portfolio fluctuations as they happen.
Insight Panel Enhancements
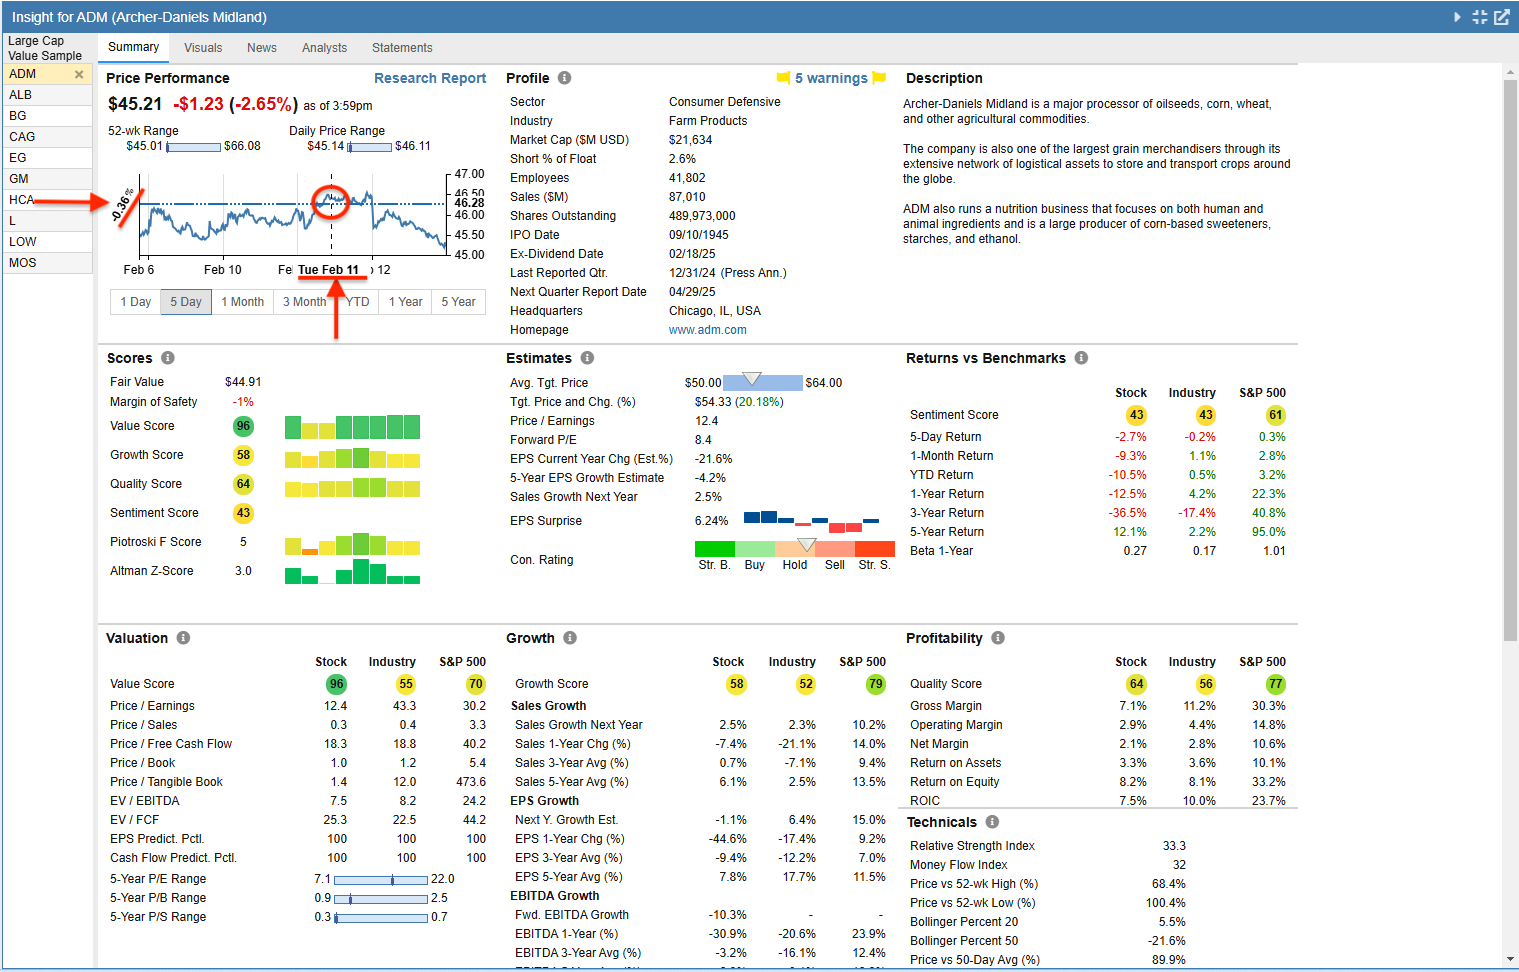
The Summary [12] tab’s Price Performance Chart now includes crosshairs and percentage display on mouseover, making it easier to see price changes.
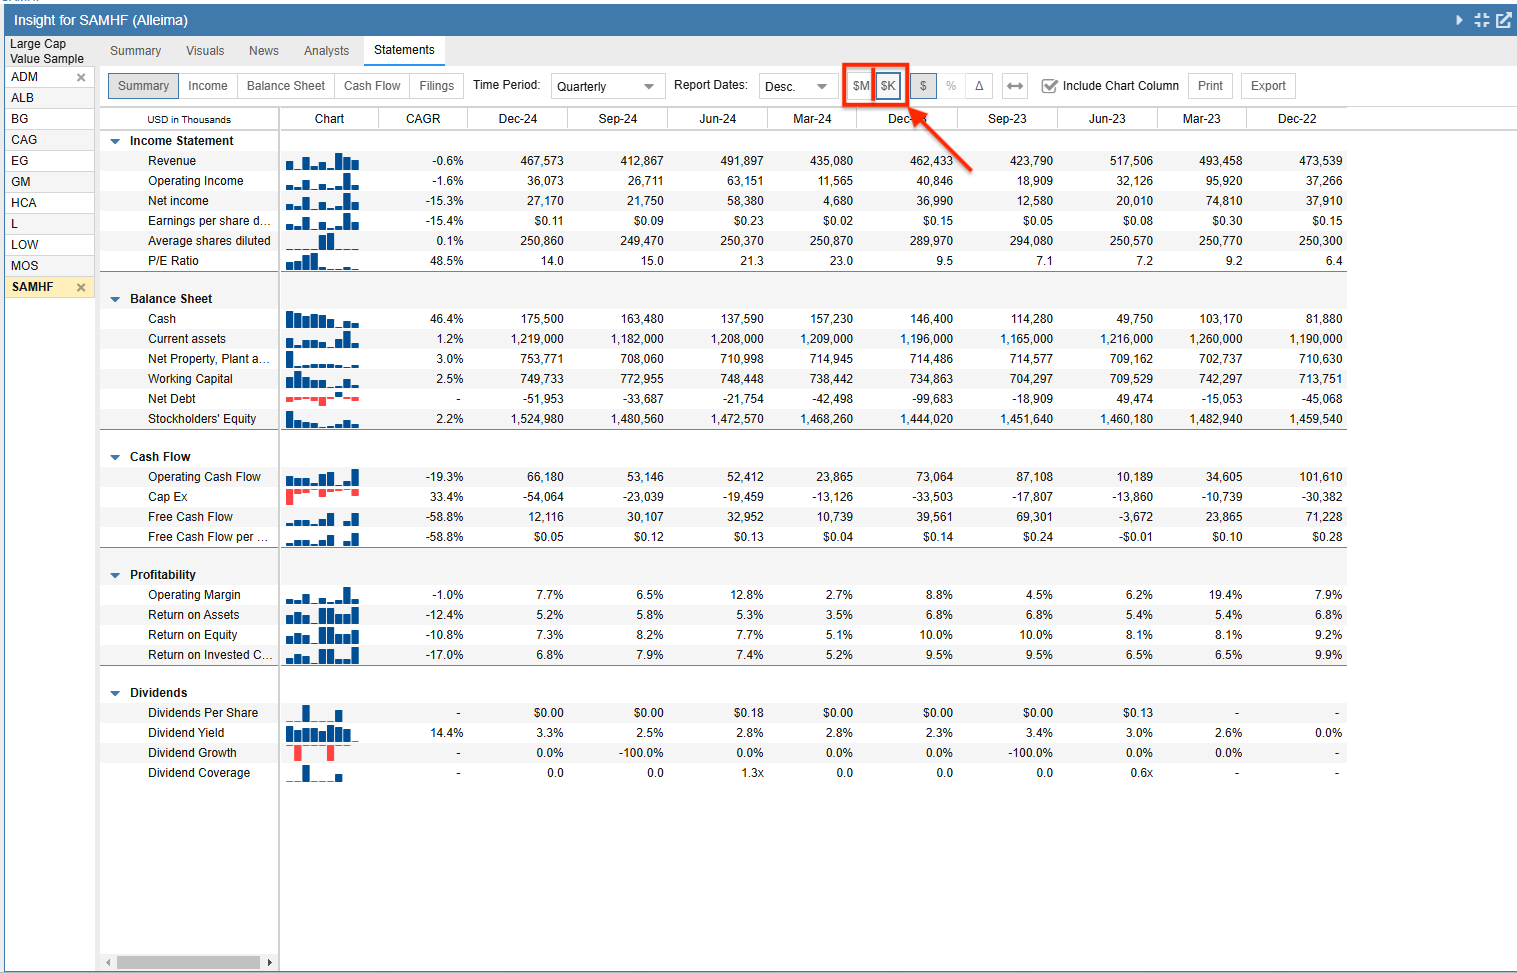
The Statements [14] tab can now display financials in millions ($M) or thousands ($K). The new option to display in thousands ($K) provides for better readability, especially for smaller companies.
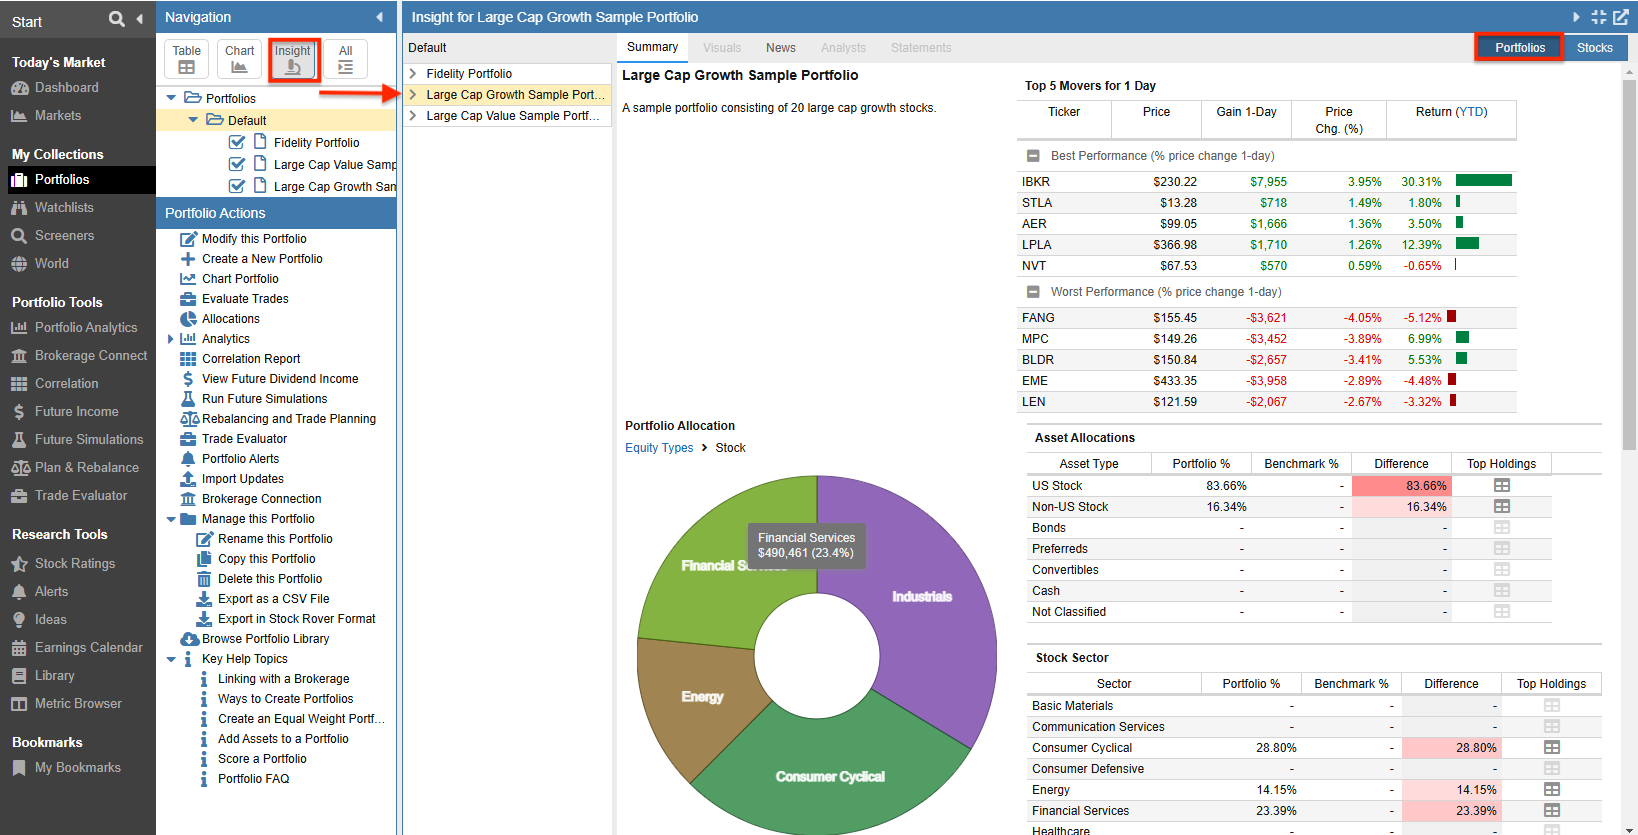
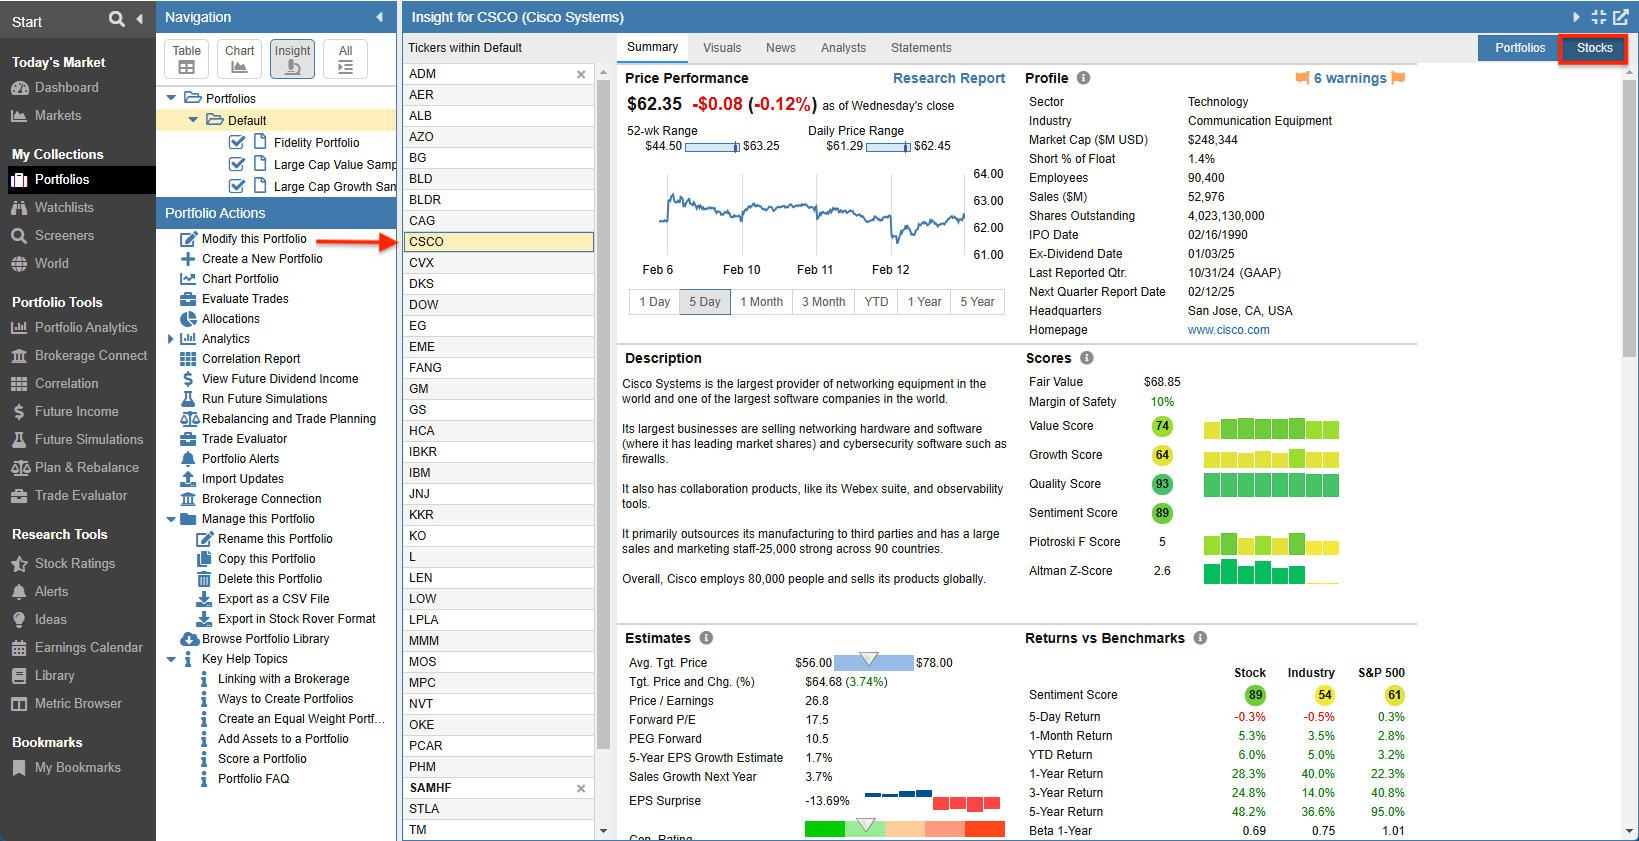
A new “Portfolios | Stocks” control allows quick toggling between Portfolios and Stocks when the Insight Panel is expanded [16] and portfolios are chosen using multi-select [17].
When multiple portfolios are chosen via multi-select, the Insight Panel will show information at the portfolio level (including allocation information) when Portfolios is clicked in the upper right of the Insight Panel.
Clicking Stocks allows for any ticker selected from the chosen list of portfolios to be displayed in the Insight Panel.
Charting Enhancements
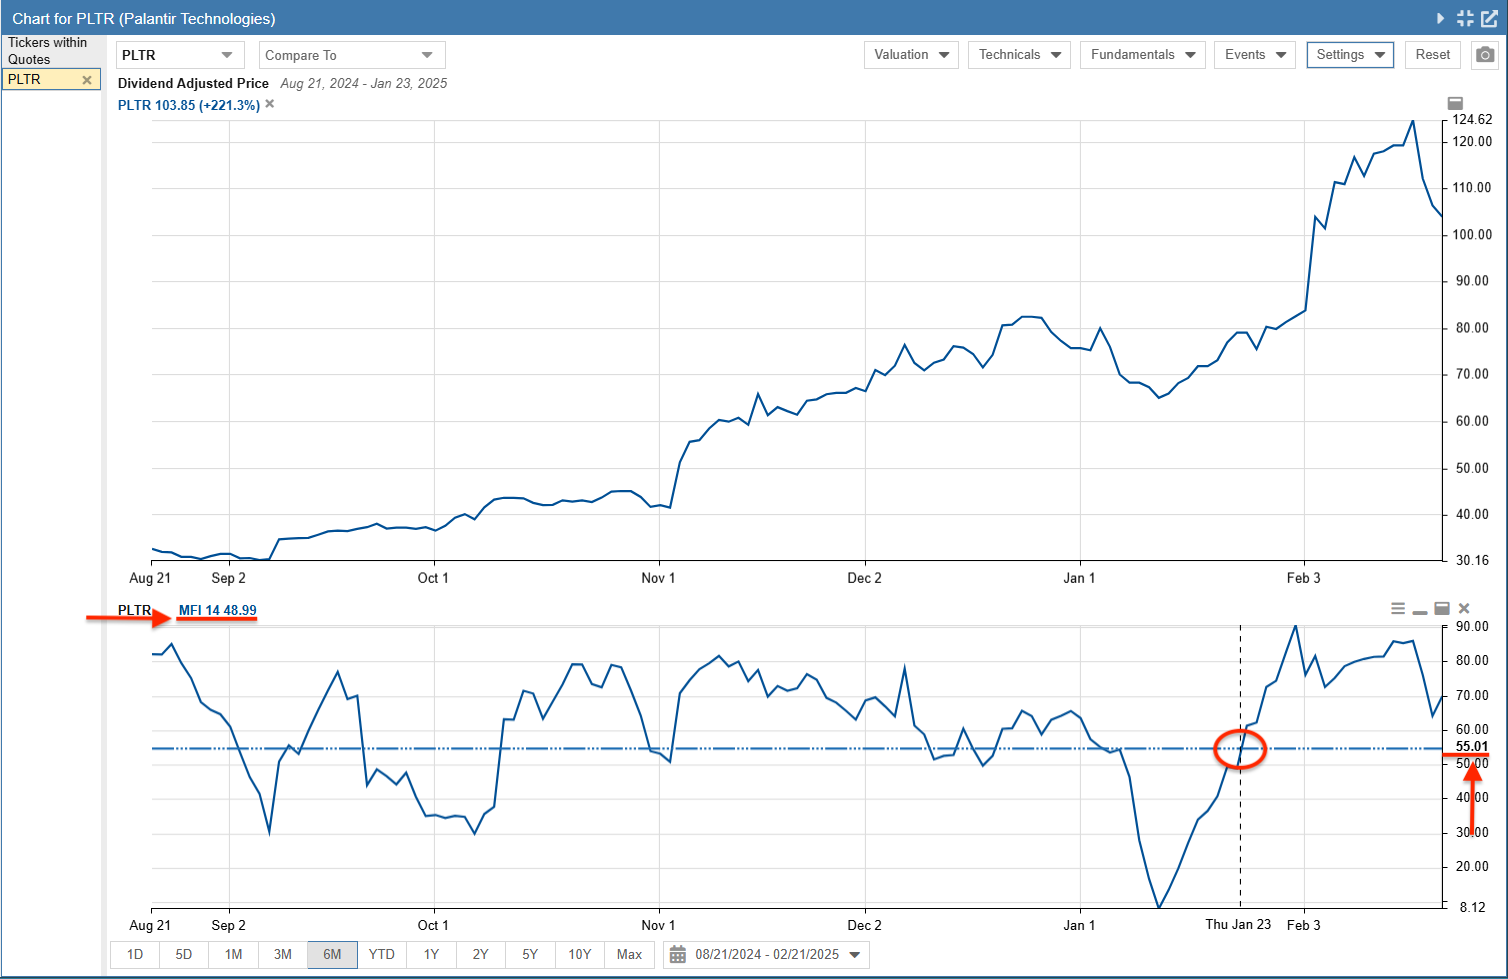
Technicals [20] that render as line series charts now include a crosshair display on mouseover. The crosshair allows you to pinpoint indicator values and timestamps, making it easier to interpret the data accurately.
Supported Technicals include:
- Aroon Indicator
- Average Directional Index
- Average True Range
- Bollinger Bands
- Exponential Moving Average
- Forward Return
- Keltner Channels
- Money Flow Index
- Moving Average Convergence Divergence
- Relative Strength Index
- Simple Moving Average
Example: The chart below shows the Money Flow Index value for Palantir Technologies on January 23, 2025.
Additions to Portfolio Analytics
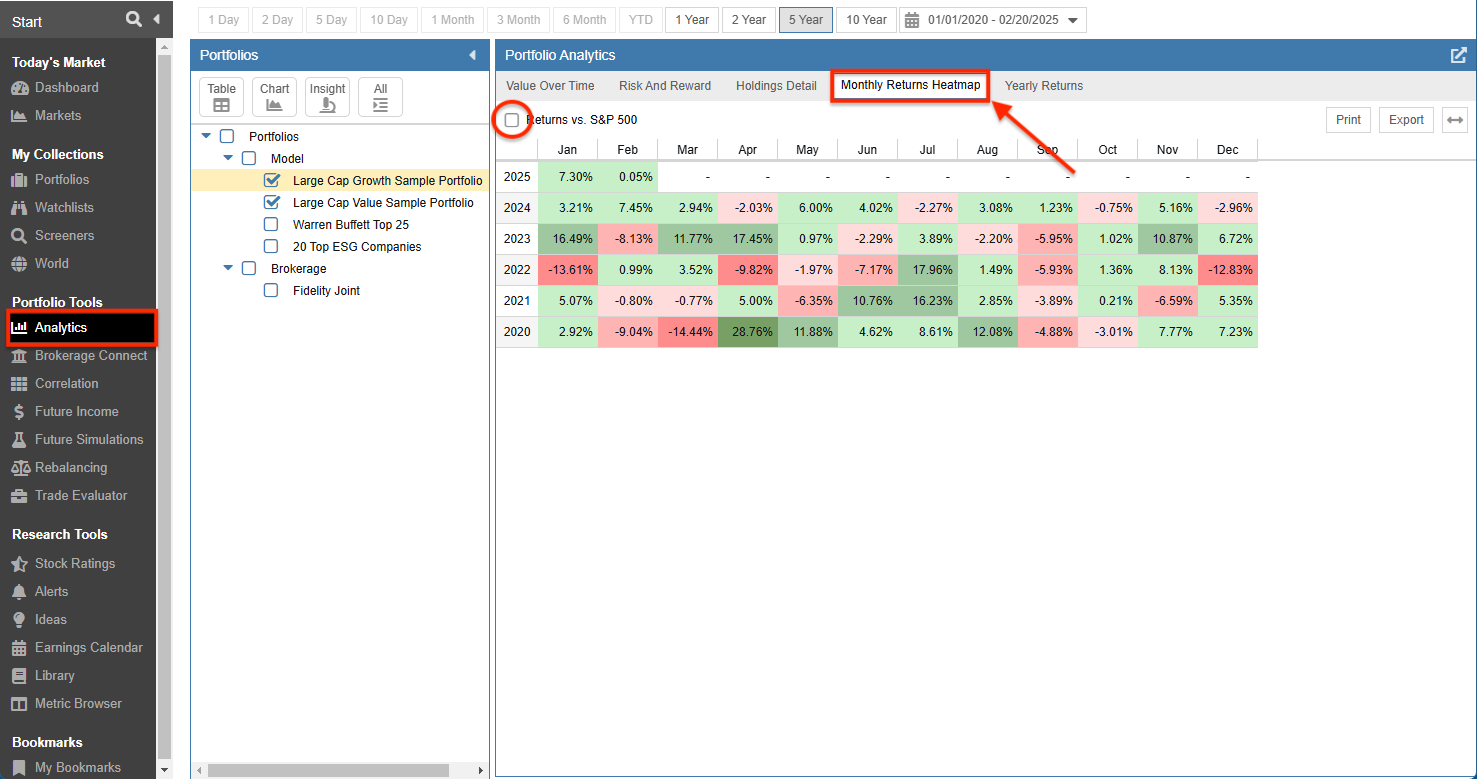
Monthly Returns HeatMap – A new monthly heatmap tab has been added to Analytics to provide a visual representation of your portfolio performance each month.
This heatmap allows you to quickly identify trends and patterns in your portfolio monthly returns, giving you a deeper understanding of performance over time. You can also compare your portfolio monthly performance against the S&P 500.
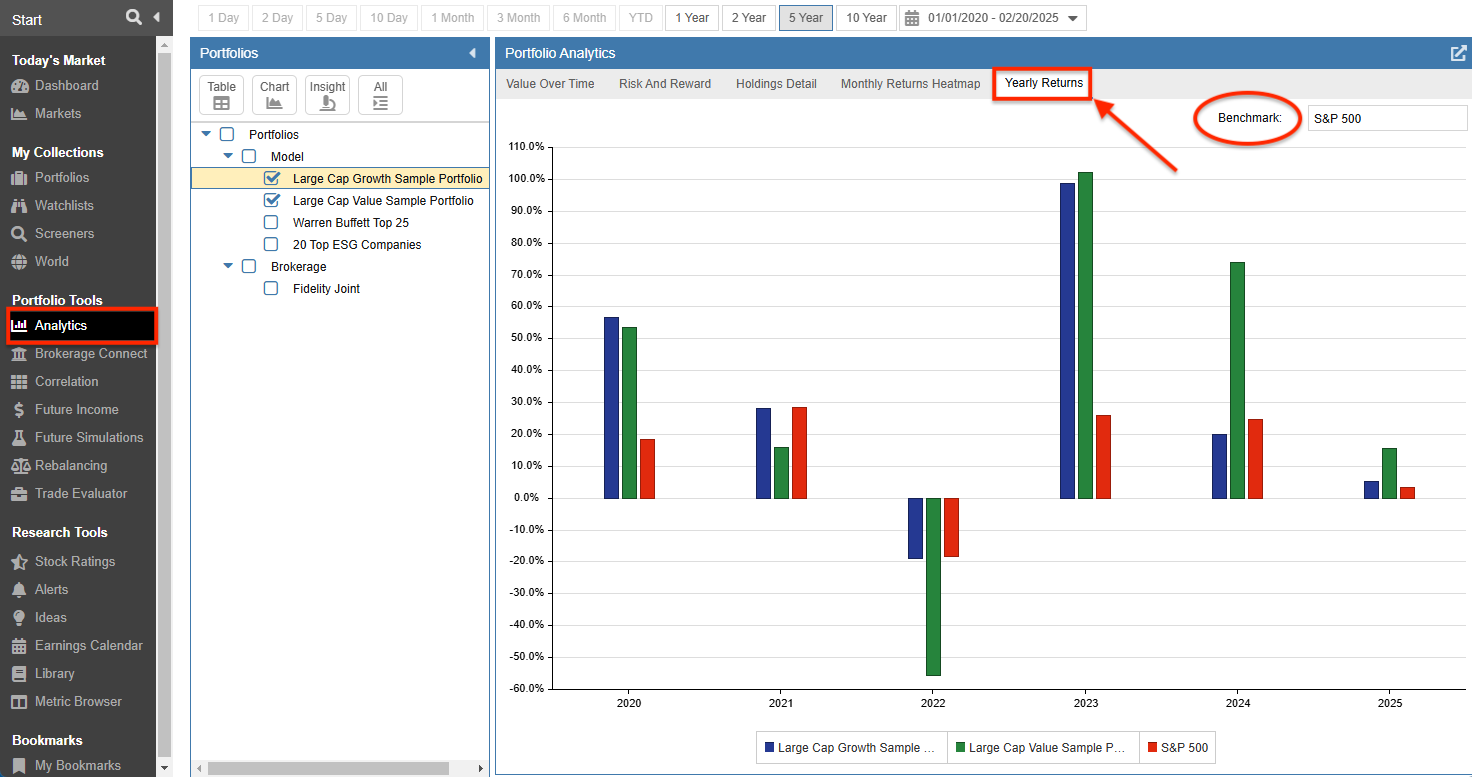
Yearly Returns – A new yearly returns bar chart displays the annual returns of your selected portfolios.
This chart provides a clear and concise overview of portfolio yearly performance. You can also include a benchmark, enabling you to easily see how your portfolio yearly returns compare to a specific market index or another benchmark of your choice.
New Relative Date Screening
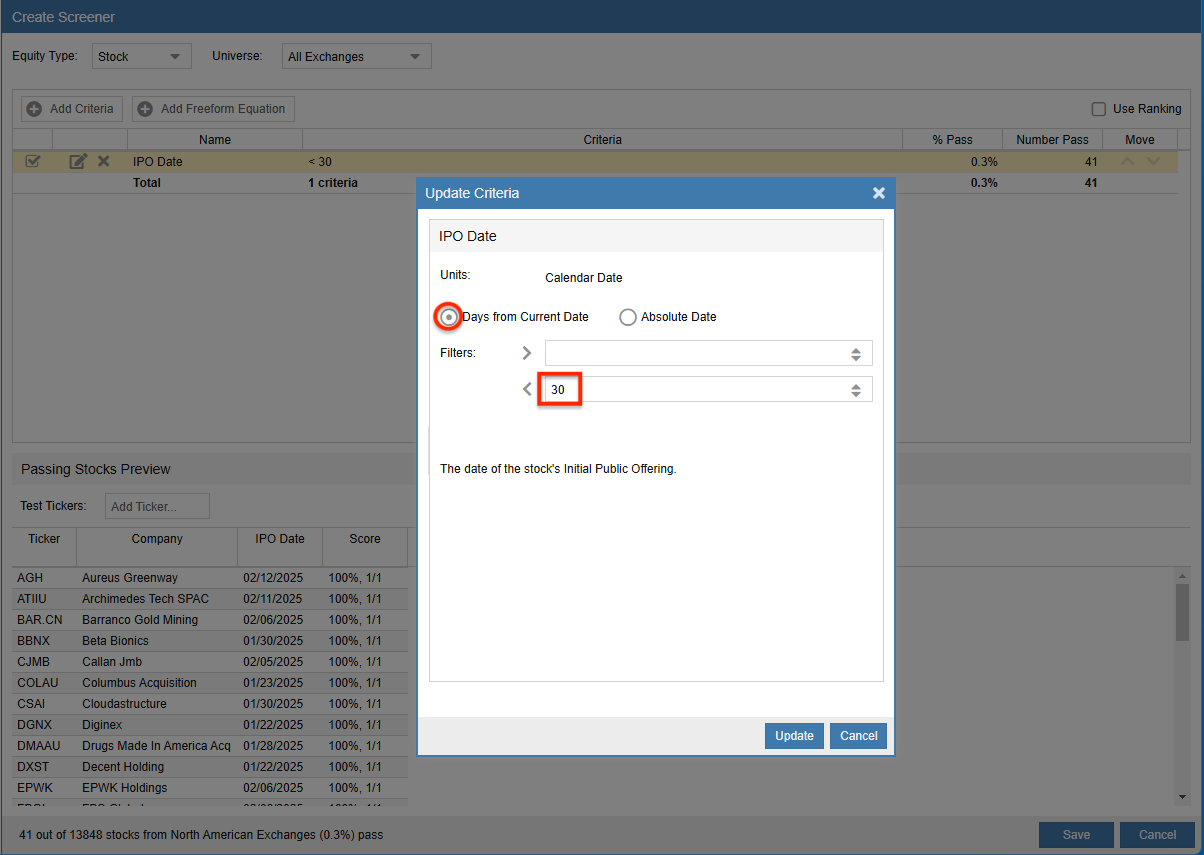
You can now screen on a relative date range using “Days from Current Date.”
This feature automatically adjusts the date range, so you don’t have to manually set start and end dates.
Example: The filter below identifies companies that went public within the last 30 days.
New Metrics
Below is a list of new metrics that are available for screening [25] and display [26].
For more detailed information on each of these metrics, please see the metric browser [27].
| Metric | Description |
|---|---|
| 2-Day $Volume (Avg) | The 2 day average dollar volume of the stock. |
| 2-Day Return | The total return over 2 days including dividend payments as if they were immediately re-invested. |
| 2-Day Volume (Avg) | The 2 day average volume of the stock. |
| 2-Day Return vs Industry | The total return including dividends of the stock versus that of its industry over 2 days calculated as the stock’s return minus that of the market-cap-weighted average return of stocks in its industry. |
| 2-Day Return vs S&P 500 | The total return including dividends of the stock minus that of the S&P 500 over 2 days. |
| 2-Day Return vs Sector | The total return including dividends of the stock versus that of its sector over 2 days calculated as the stock’s return minus that of the market-cap-weighted average return of stocks in its sector. |
| Accounts Payable | Any money that a company owes its suppliers for goods and services purchased on credit and is expected to pay within the next year or operating cycle. |
| Accounts Payable as a % of Sales |
Accounts payable as a percent of sales. |
| Basic Shares | The total number of outstanding shares that a company has in millions as reported in quarterly or annual filings. |
| Business Type | The Business Type field shows when the stock has a special business structure, including BDC (business development company), REIT (Real Estate Investment Trust), LP (Limited Partnership), LLC (Limited Liability Corporation), and SPAC (Special Purpose Acquisition Company). |
| Current Accrued Expenses | Accrued expense is a liability that has been incurred, recognized on the income statement, but has not actually been paid yet. Current accrued expenses have to be paid within a current 12-month period. |
| Current Deferred Sales | Current deferred sales (deferred revenue) is a liability on a company’s balance sheet that represents money received in advance for goods or services that will be delivered within the next fiscal year. |
| Float | The number of shares available for the general investing public to buy and sell. It does not include, among other things, restricted stock held by insiders. |
| Insider Ownership % | Insider Ownership refers to the ownership stake in a company that is held by company insiders with access to sensitive information. |
| Issuance of Debt | The total cash inflow from new debt issued. |
| Issuance of Long Term Debt | The cash inflow from a debt initially having maturity due after one year or beyond the operating cycle, if longer. |
| Net Asset Value | Net Asset Value (NAV) is a the value of an ETF’s assets minus its liabilities, divided by the number of shares outstanding. |
| Non-Current Deferred Sales | Non-current deferred sales (deferred revenue) is a liability on a balance sheet that represents sales a company has received from customers but is not yet expected to recognize as revenue within the next 12 months. |
| Price % of NAV | Price as a percent of Net Asset Value shows if the ETF is trading at a premium (above 100) or a discount (below 100) to its underlying assets. |
| Retained Earnings | The cumulative net income of the company from the date of its inception (or reorganization) to the date of the financial statement less the cumulative distributions to shareholders either directly (dividends) or indirectly (treasury stock). |
| Short % of Shares Outstanding | The percentage of the company’s publicly traded shares that have been shorted. Reporting delays for this column may be as long as a month. |
| Total Tax Payable | A liability that reflects the taxes owed to federal, state, and local tax authorities. It is the carrying value as of the balance sheet date of obligations incurred and payable for statutory income, sales, use, payroll, excise, real, property and other taxes. |
Summary
We hope that you find the new features added to Stock Rover to be useful. Please let us know what you think in the comments section below.
19 Comments To "New Stock Rover V10 Features"
#1 Comment By pritam patel On February 27, 2025 @ 6:07 am
Hi,
Can we have 50 day Avg volume?
Thanks,
#2 Comment By Ken Leoni On February 27, 2025 @ 8:19 am
We’ll certainly send your request to development for future consideration.
#3 Comment By Elwin Pietersz On March 1, 2025 @ 2:46 am
Hi, In portfolio, when I sell, I need the ability to enter the actual price sold and not the day closing price. Can you please provide this feature?
#4 Comment By Howard Reisman On March 1, 2025 @ 5:57 am
Its coming.
#5 Comment By Bee Vee On March 1, 2025 @ 7:46 am
Hi,
Can we have Crypto, Derivatives and Index Options to be added. Right now Options and Derivatives are treated as Assets. Also can we have Crypto’s added to Collections (Screeners and Watchlist)
Thanks
#6 Comment By Ken Leoni On March 3, 2025 @ 1:01 pm
Crypto is most definitely coming, though we don’t yet have an ETA. Options are a bit farther out, and other derivatives are not planned at this point.
#7 Comment By Bruce Fleet On March 1, 2025 @ 11:12 am
Please consider adding a Risk Metrics folder that might include: Sharpe, Ratio Up/Down Capture Ratio, Treynor Ratio, Beta, Alpha, Information Ratio. I know a couple of these metrics are available in different areas. I am asking to have them available on my customized table view.
#8 Comment By Ken Leoni On March 3, 2025 @ 9:20 am
These metrics are on the list for future consideration.
#9 Comment By Jeff Williams On March 1, 2025 @ 11:19 am
5 Year Beta would be great.
#10 Comment By Ken Leoni On March 3, 2025 @ 8:55 am
This feature request is currently on the list for future consideration.
#11 Comment By Walter Heindl On March 1, 2025 @ 3:58 pm
I see that Net Asset Value (and price as a percentage of NAV) has been added as a metric, but only for ETF’s. While it is possible for an ETF’s price and NAV to diverge, these differences are usually slight (you’ll see a lot of 98% and 101%’s if you add that column). This is a much more important metric for closed-end funds (CEF’s), where share price and NAV can diverge substantially; analysts of CEF’s invariably discuss these and whether a low price to NAV presents a buying opportunity. I’d like to see these metrics extended from ETF’s to CEF’s.
#12 Comment By Ken Leoni On March 3, 2025 @ 8:49 am
We will send this over to the development team for a closer look.
#13 Comment By Juan Arenas (Premium Plus Member) On March 1, 2025 @ 6:09 pm
Hi, under the new monthly returns heat map, which is a great addition, can a new row be added to show the total return by month overtime? for instance if the heat map shows the return by month from 2015 to 2025, can a row showing the total return per month be added at the end of January, February, etc… and a new column after the month of December showing the total return over a specific year? For instance, 2025, 2024, 2023, etc…
Thank you for the great product you have develop and the constant updates to improve users experience.
#14 Comment By Ken Leoni On March 3, 2025 @ 8:36 am
Thank you for the kind words.
I’m sending your request for an additional column that shows the annual return and an additional row that shows the monthly return to our development team.
#15 Comment By Fabio Parra On March 2, 2025 @ 10:31 pm
Hi, can be added the P/E mean in the Graph, the PE must be automatically adjusted if it is select 2 years, 5 years, 10 years or Max. Thank you
#16 Comment By Ken Leoni On March 3, 2025 @ 8:18 am
The ability to add the mean to a fundamental chart would probably be the best way to handle this in the future. We’ll add this to the list for consideration.
#17 Comment By Jeff Williams On March 5, 2025 @ 7:52 pm
These are great additions. I love the monthly heat map.
Under event and portfolio activity, is it possible to have difference symbols or colors or both to distinguish between buy and sell.
#18 Comment By Howard Reisman On March 6, 2025 @ 6:17 am
Thank you. We are glad you like the improvements. That is a good idea for buy and sell and we will consider adding it to a future release.
#19 Comment By Thury On March 29, 2025 @ 1:56 pm
Thank you for your hard work and frequent upgrades! I love Stock Rover!!!